


According to OAG, the United States has the largest domestic aviation market in the world, standing at just over 92 million seats in October 2025. This is 27% more than the 72 million seats offered in second-placed China, and more than five times as many as India, which is a distant third. But where are all these domestic flights going to, and which are the most popular US routes?
Using data from Cirium, an aviation analytics company, we can rank the 10 most popular airline routes by seat availability in the US this month, as well as the airline share on each route. Somewhat surprisingly, this ranking can change considerably due to seasonality or demand fluctuations, so also included below are year-over-year comparisons to the same data from October 2024.
10
Denver – Las Vegas
239,000 seats in October (-4% vs 2024)

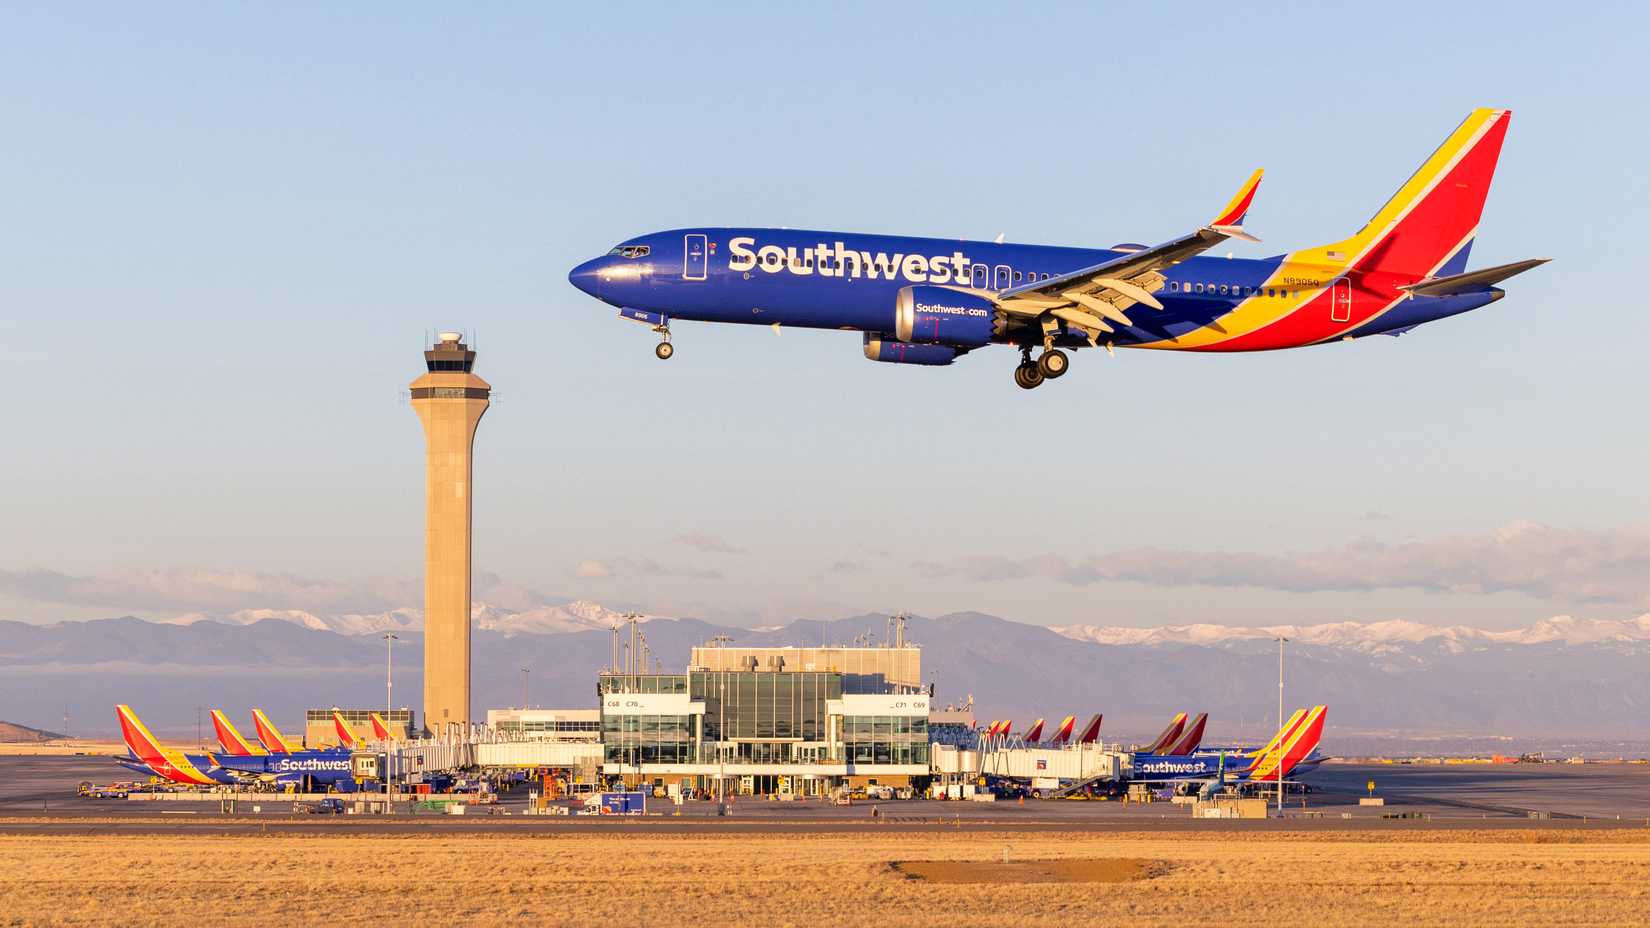
In tenth position is the route between ![]()
![]()
![]()

|
Market Share: DEN-LAS |
|
|---|---|
|
Southwest Airlines |
40% |
|
United Airlines |
35% |
|
Frontier Airlines |
25% |
The route has dropped from ninth to tenth place in the rankings since 2024, shedding approximately 4% of its capacity from last year. A key driver of the decline is that Spirit Airlines chose to discontinue all service to Denver last year, citing underperformance of the route and operational constraints. So, while it still operates nearly 30 routes from Las Vegas, even in its current weakened state, it is no longer on this route to Denver.
9
Denver – Chicago O’Hare
243,000 seats in October (+2% vs 2024)

Rising up a place in the rankings is the route from Denver to ![]()
|
Market Share: DEN-ORD |
|
|---|---|
|
United Airlines |
61% |
|
American Airlines |
19% |
|
Southwest Airlines |
12% |
|
Frontier Airlines |
8% |
Interestingly, Southwest Airlines has some market share on this route. The carrier’s primary presence in Chicago is at Midway International Airport, where the carrier operates hundreds of daily departures, including seven daily round trips to Denver. However, Southwest began operating at O’Hare in 2021 to provide its customers with a choice of airports in Chicago, and now flies to eight US destinations from ORD with 14 daily departures. Three of those are on the route to Denver.
8
Honolulu – Kahului
248,000 seats in October (-12% vs 2024)
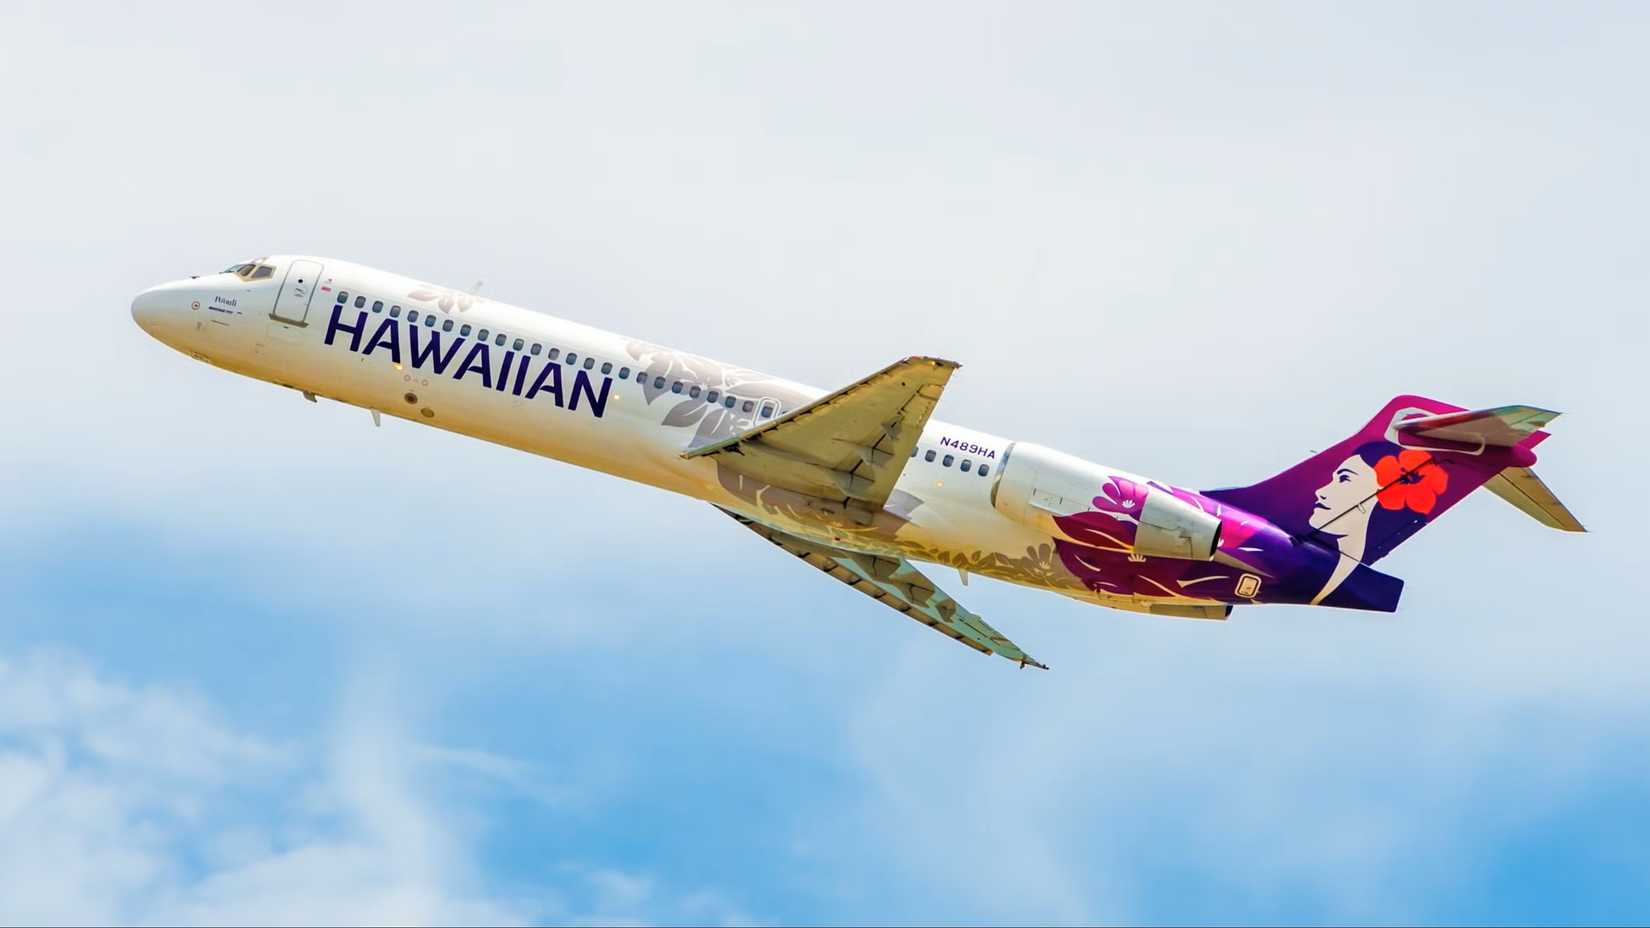
The inter-island route from Honolulu International Airport to Kahului Airport is the busiest route in the US when measured by number of flights. There are 1,272 services in October, or more than 40 a day on average. It is operated by just two airlines and dominated by Hawaiian Airlines, which has between 15 and 20 flights a day and a two-thirds share of all seats.
|
Market Share: HNL-OGG |
|
|---|---|
|
Hawaiian Airlines |
66% |
|
Southwest Airlines |
34% |
Despite the large number of flights, the route itself only comes in eighth on the list in terms of the number of available seats. This is primarily because Hawaiian Airlines utilizes its Boeing 717s exclusively on the 40-minute hop from O‘ahu to Maui. At just 128 seats, they are smaller than the typical narrowbodies that dominate the other routes on the list. The route is also notable for having a 12% drop in available seats compared to last year.
Part of that is due to the lingering after-effects of the Maui wildfires, but primarily because of a reduction in flights by Southwest. Starting in April, Southwest significantly cut its inter-island schedule, and reduced the Honolulu to Kahului route by 30% to eight daily round-trips. The airline blamed poor demand, with its Hawaiian routes delivering some of the lowest load factors across its network, including just 39% on the HNL-OGG route in the year prior to the cuts.
7
Los Angeles – Las Vegas
261,000 seats in October (-14% vs 2024)

For those not wanting to make the four (but sometimes eight) hour drive on I-15 between Los Angeles and Las Vegas, an alternative is one of the busiest flight corridors in the US, with scheduled service from eight different airlines to choose from. While Southwest has historically been the largest operator on the route, it is by no means dominant. Indeed, legacy airlines, low-cost carriers, and even semi-private carrier JSX all compete and will collectively provide over 260,000 seats this month.
|
Market Share: LAX-LAS |
|
|---|---|
|
Southwest Airlines |
24% |
|
Delta Air Lines |
19% |
|
United Airlines |
17% |
|
American Airlines |
13% |
|
Frontier Airlines |
9% |
|
Alaska Airlines |
8% |
|
Spirit Airlines |
8% |
|
JSX |
1% |
The LAX-LAS route has seen a significant 14% drop-off from the more than 300,000 seats that were on offer in October 2024. The Las Vegas Convention and Visitors Authority has reported a significant drop in visitor numbers, especially from California, leading airlines to adjust their schedules to better match the lower demand. This has had a greater impact on smaller airlines, with Spirit cutting its Las Vegas network by half, and Allegiant Air pulling out of the LAX-LAS route altogether.
6
Atlanta – Orlando
262,000 seats in October (-9% vs 2024)
The route from Atlanta to ![]()
|
Market Share: ATL-MCO |
|
|---|---|
|
Delta Air Lines |
66% |
|
Frontier Airlines |
17% |
|
Southwest Airlines |
14% |
|
Spirit Airlines |
5% |
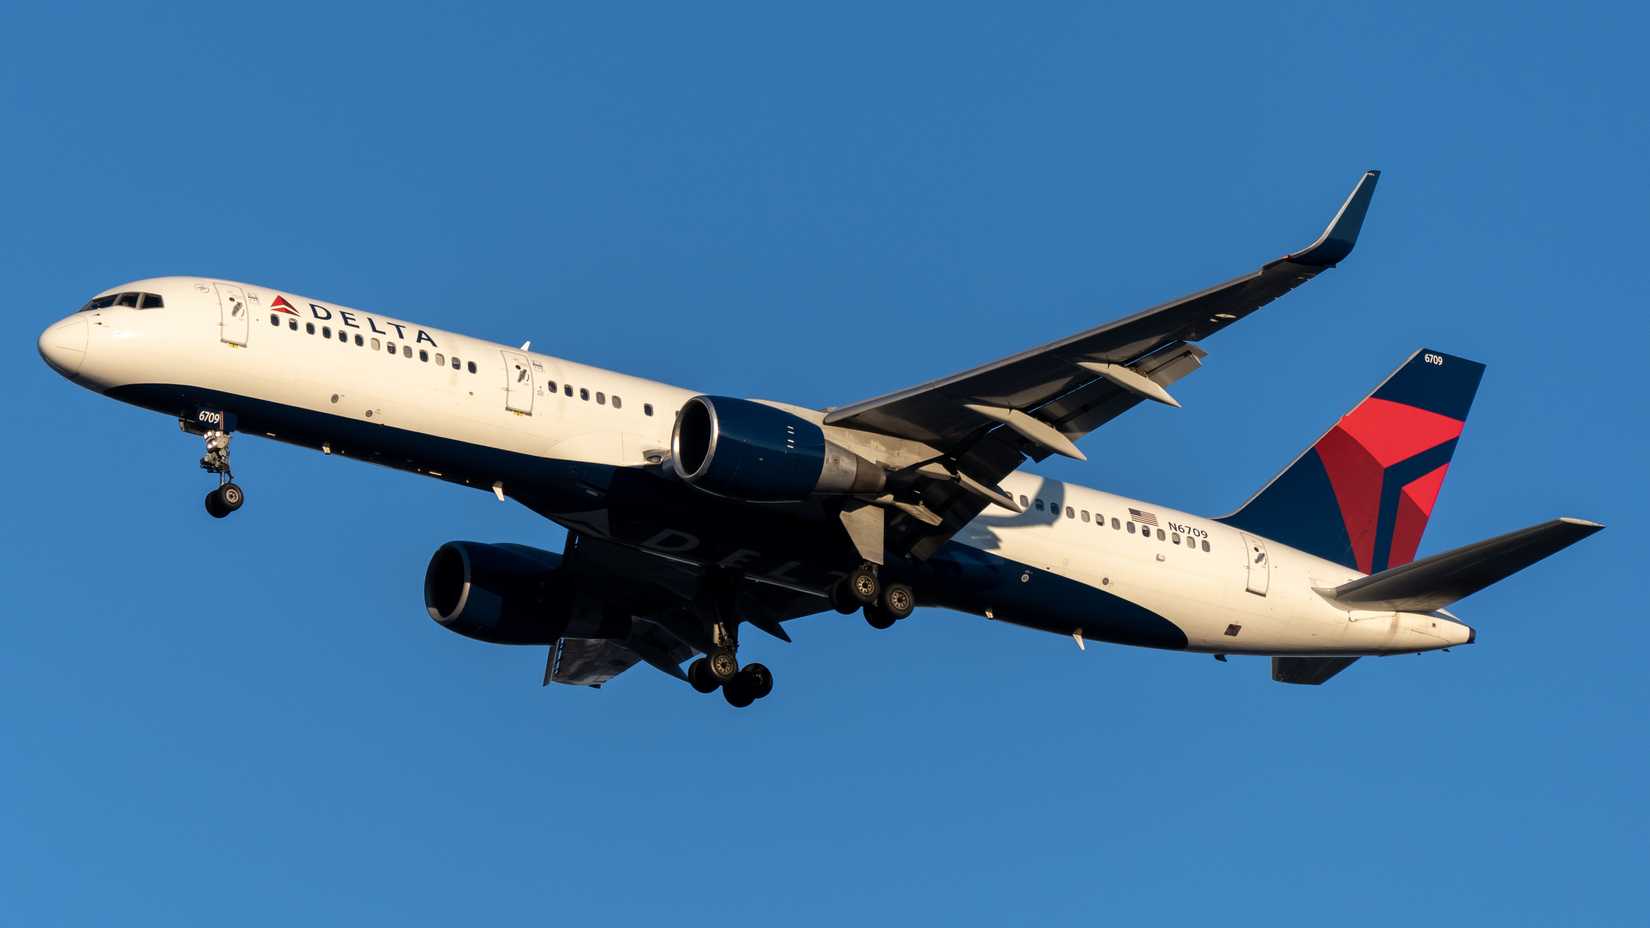
If you’re a fan of the Boeing 757 (and who isn’t?), then ATL-MCO is the ideal route to catch a ride aboard the pocket rocket before it heads for retirement in a few years. Delta operates the 757 almost exclusively for its 15 return flights a day between the two cities, although, more recently, it has been adding widebody capacity via Airbus A330s and Boeing 767s to cater for heightened demand at weekends.
Delta’s dominance on the route is also partly responsible for the 9% drop in seat capacity compared to October last year. Southwest has significantly reduced its service at ![]()
5
Atlanta – New York LaGuardia
263,000 seats in October (+1% vs 2024)

What’s even busier than a route anchored by a Delta hub? One that is anchored by two Delta hubs, and that’s the case with the route from Atlanta to ![]()
|
Market Share: ATL-LGA |
|
|---|---|
|
Delta Air Lines |
63% |
|
Southwest Airlines |
14% |
|
Frontier Airlines |
13% |
|
American Airlines |
10% |
Delta’s strategy on the ATL-LGA route has shifted significantly in recent years towards using larger mainline aircraft rather than regional jets, and it now uses its Airbus A321 fleet exclusively on the route. This summer, the airline announced that it operated about 100 fewer flights on the ATL-LGA route compared to pre-pandemic, but had a larger overall seat capacity. By comparison, its legacy competitor on the route is American Airlines, which exclusively uses Embraer E175s.
4
Denver – Phoenix
280,000 seats in October (+7% vs 2024)


The top five most popular air corridors are all hub-to-hub routes, but Denver to ![]()
|
Market Share: DEN-PHX |
|
|---|---|
|
Southwest Airlines |
42% |
|
United Airlines |
27% |
|
Frontier Airlines |
20% |
|
American Airlines |
10% |
This route has been one of the fastest-growing in the top 10, with Southwest, United, and Frontier Airlines all having expanded their schedules over the past year. It is also a seasonal route that actually increases in capacity over the winter, whether it is travelers seeking the warmth of Arizona via Phoenix, or the winter activities of the Rockies via Denver.
3
Los Angeles – San Francisco
288,000 seats in October (-10% vs 2024)

This route has long been a critical business and commuter route, linking two of California’s largest economic hubs, and is the largest intra-state route in California. As a result, it is highly contested by six airlines, none of which have been able to claim a dominant position. United Airlines, flying between its two west coast hubs, is the largest with a 35% share.
|
Market Share: LAX-SFO |
|
|---|---|
|
United Airlines |
35% |
|
Delta Air Lines |
24% |
|
Southwest Airlines |
13% |
|
American Airlines |
11% |
|
Alaska Airlines` |
11% |
|
Frontier Airlines |
7% |
However, this route has also seen a decline in year-over-year seat availability, something that many blame on the increase in remote work, particularly in the tech sector. That may be so, but at least another reason is the continued strong growth of secondary airports in both cities, providing an alternative (and often far more convenient) routing. Options include Hollywood Burbank, Long Beach, and John Wayne Airport in Southern California, and San Jose or Oakland in the Bay Area.
2
New York JFK – Los Angeles
307,000 seats in October (+9% vs 2024)

The transcontinental route connecting the two largest cities in the US is often top of the list as the most popular in terms of number of available seats, but, in October, it comes in second, with just over 300,000. The evergreen route has high demand throughout the year, serving a diverse mix of business travelers, entertainment industry professionals, and leisure passengers.
Delta Air Lines offers a similar number of daily flights as its primary competitors (9–10 return flights daily), but has a far larger market share as it exclusively operates its A330 and 767 widebodies on the route. This allows it to offer a more premium service, including lie-flat seats in its Delta One cabin.
|
Market Share: JFK-LAX |
|
|---|---|
|
Delta Air Lines |
43% |
|
JetBlue |
31% |
|
American Airlines |
22% |
|
Frontier Airlines |
5% |
This is the only route in the Top 10 that JetBlue appears in, but it does so with an impressive 31% market share for the hybrid carrier. JetBlue first flew the JFK-LAX route 15 years ago, decades after its legacy competitors. However, the introduction of its Mint service, featuring lie-flat seats and a premium cabin experience on the A321, significantly disrupted the transcontinental market and forced competitors to upgrade their offerings.
American Airlines also views this route as a flagship, operating specially configured A321T narrowbody jets with premium space in the business class cabin for lie-flat seats. It has also started introducing its Boeing 777 widebodies on the route, and will debut its new Airbus A321XLRs in the coming months.
1
New York LaGuardia – Chicago O’Hare
320,000 seats in October (+13% vs 2024)

The most popular route in the top 10, as well as the one that has shown the most growth, is between New York LaGuardia and Chicago O’Hare. It is a rare opportunity to witness all three of the large legacy carriers battling it out for the high proportion of premium passengers flying between two major business centers, with each airline anchored in at least one of its major hubs.
|
Market Share: LGA-ORD |
|
|---|---|
|
United Airlines |
46% |
|
American Airlines |
29% |
|
Delta Air Lines |
21% |
|
Spirit Airlines |
5% |
United Airlines is the leader on the route, offering 15 return flights daily with an all-737 service. American Airlines, which has hubs at both ends of the route, trails with 10 daily flights, with some operated by regional subsidiaries. Delta has adopted a flexible strategy according to demand, making use of its 737s and smaller Airbus A220s depending on the flight timing and day of the week.
LGA-ORD is the Top 10 route that has grown most year-over-year, and much of this has been spurred on by the growing rivalry between United and American in Chicago. Both have added a significant number of flights at their shared Midwest hub, including a boost to their flights to New York. Infrastructure improvements at both airports have also been credited with facilitating the growth.
source