


Every year, a handful of megahub airports move more people than the airport systems of entire developed countries. We analyze the world’s ten busiest airports in order to capture more than just raw overall passenger figures. We look to create a snapshot of economic gravity, airline strategy, and the power that geography holds over the development of route networks. Aircraft volumes reflect local demand, connectivity, and the tug-of-war between transfer traffic and origin-and-destination flows.
Capacity, slots, and curfews shape the overall leaderboard as much as runways and airport terminals. As travel begins to normalize and long-haul patterns emerge, these airports continue to evolve. These facilities continue to add gates, find ways to digitize journeys, and rethink security and baggage flows. We now dig into who leads the airport traffic leaderboard, what makes these the dominant facilities, and which trends are most likely to reshape next year’s overall rankings. Two factors are used to determine this ranking, as laid out by OAG. This includes both the number of connections offered by the facility and the number of overall destinations served.
10
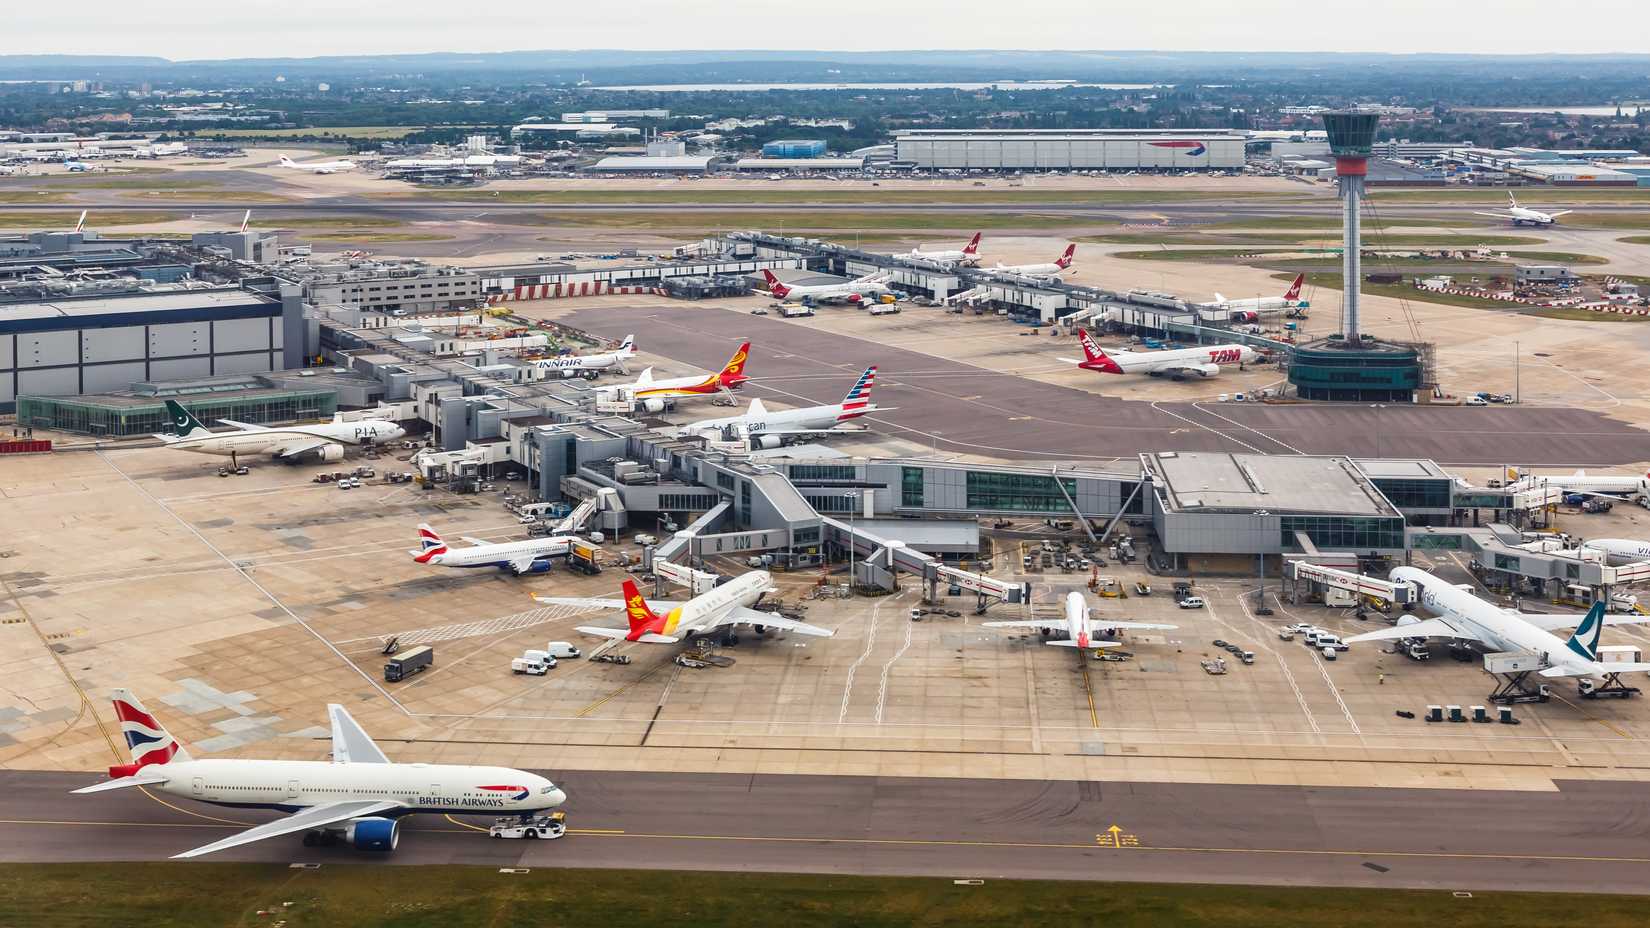
London Heathrow Airport (LHR)

![]()

|
Category: |
Specification: |
|---|---|
|
Total number of connections: |
59,240 |
|
Total number of destinations served: |
226 |
The airline anchors the oneworld network’s presence at the facility, with the alliance operating flights across the globe. The airport particularly serves as a key bridge for connecting travel across the North Atlantic. With more than 226 nonstop destinations served, the airport punches far above its size.
Overall slot scarcity helps keep yields high and schedules tightly banked, something which does expose the carrier to weather-related delays. Nonetheless, the airport continues to invest in security automation.
9
Istanbul Airport (IST)

![]()
|
Category: |
Specification: |
|---|---|
|
Total number of connections: |
82,733 |
|
Total number of destinations served: |
327 |
This enables tightly banked waves that stitch together Europe, the Middle East, Africa, Central Asia, and some far-flung leisure markets. With 82,733 measured connections and 327 nonstop destinations, IST behaves like a three-continent superhub, capitalizing on new-generation narrowbody aircraft and long-haul twin-engine models.
With a vast terminal footprint and multiple runways that can collectively accommodate rapid growth, the airport will continue to be a natural stopping point for travelers. The airport is increasingly catering to a premium clientele, with network carriers, especially those in the Star Alliance. The industry can only expect continued growth out of this important hub.
8
Amsterdam Schiphol Airport (AMS)


Amsterdam Schiphol (AMS) ranks third in 2025, reflecting KLM’s 55% market share and the airline’s enduring hub strength despite growing capacity constraints. With 66,798 connections and nonstop flights to 275 destinations, Amsterdam remains a strategic gateway for flights between North America, Europe, and Africa, in addition to short-haul coverage.
|
Category: |
Specification: |
|---|---|
|
Total number of connections: |
66,798 |
|
Total number of destinations served: |
275 |
Slot caps and large-scale environmental rules have continued to pressure schedules, but the airport’s one-roof terminal design and rail integration keep the place convenient for connecting passengers. The airline’s banked waves help synchronize passenger flow with partners.
Cargo belly capacity supports freight flows. The performance of this hub will only continue to improve, although some limiting factors may include emissions, noise and overall hub competitiveness.
7
Kuala Lumpur International Airport (KUL)
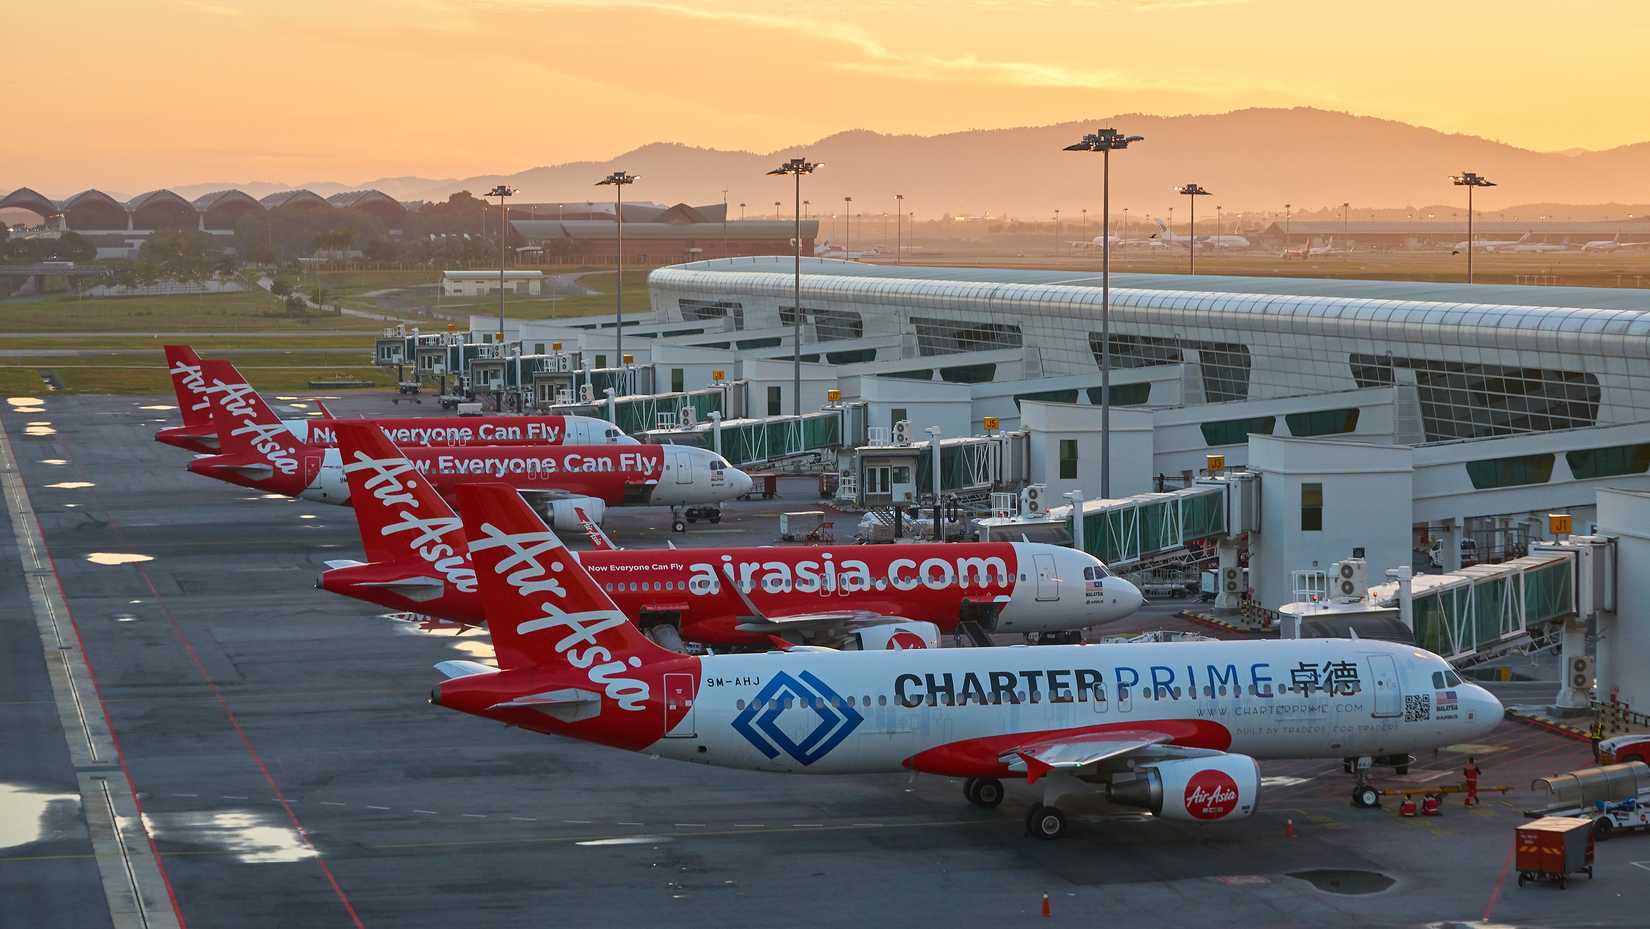
Kuala Lumpur International Airport (KUL) currently shares fourth place after slipping from second, and it remains a formidable Southeast Asian connector airline. AirAsia is the largest carrier, operating around 36% of services from the facility.
|
Category: |
Specification: |
|---|---|
|
Total number of connections: |
16,159 |
|
Total number of destinations served: |
151 |
This feeds dense regional traffic into the long-haul links that are operated by Malaysia Airlines and other foreign carriers. The facility offers more than 36,000 connections, and flights are available to more than 150 different destinations worldwide.
The airport’s two main terminals and multiple runways support punctual operations and slot availability relative to regional rival carriers. Competitive charges, visa policies, and the growing appeal of Malaysian tourism have all been direct catalysts for the airport’s continued growth.
6
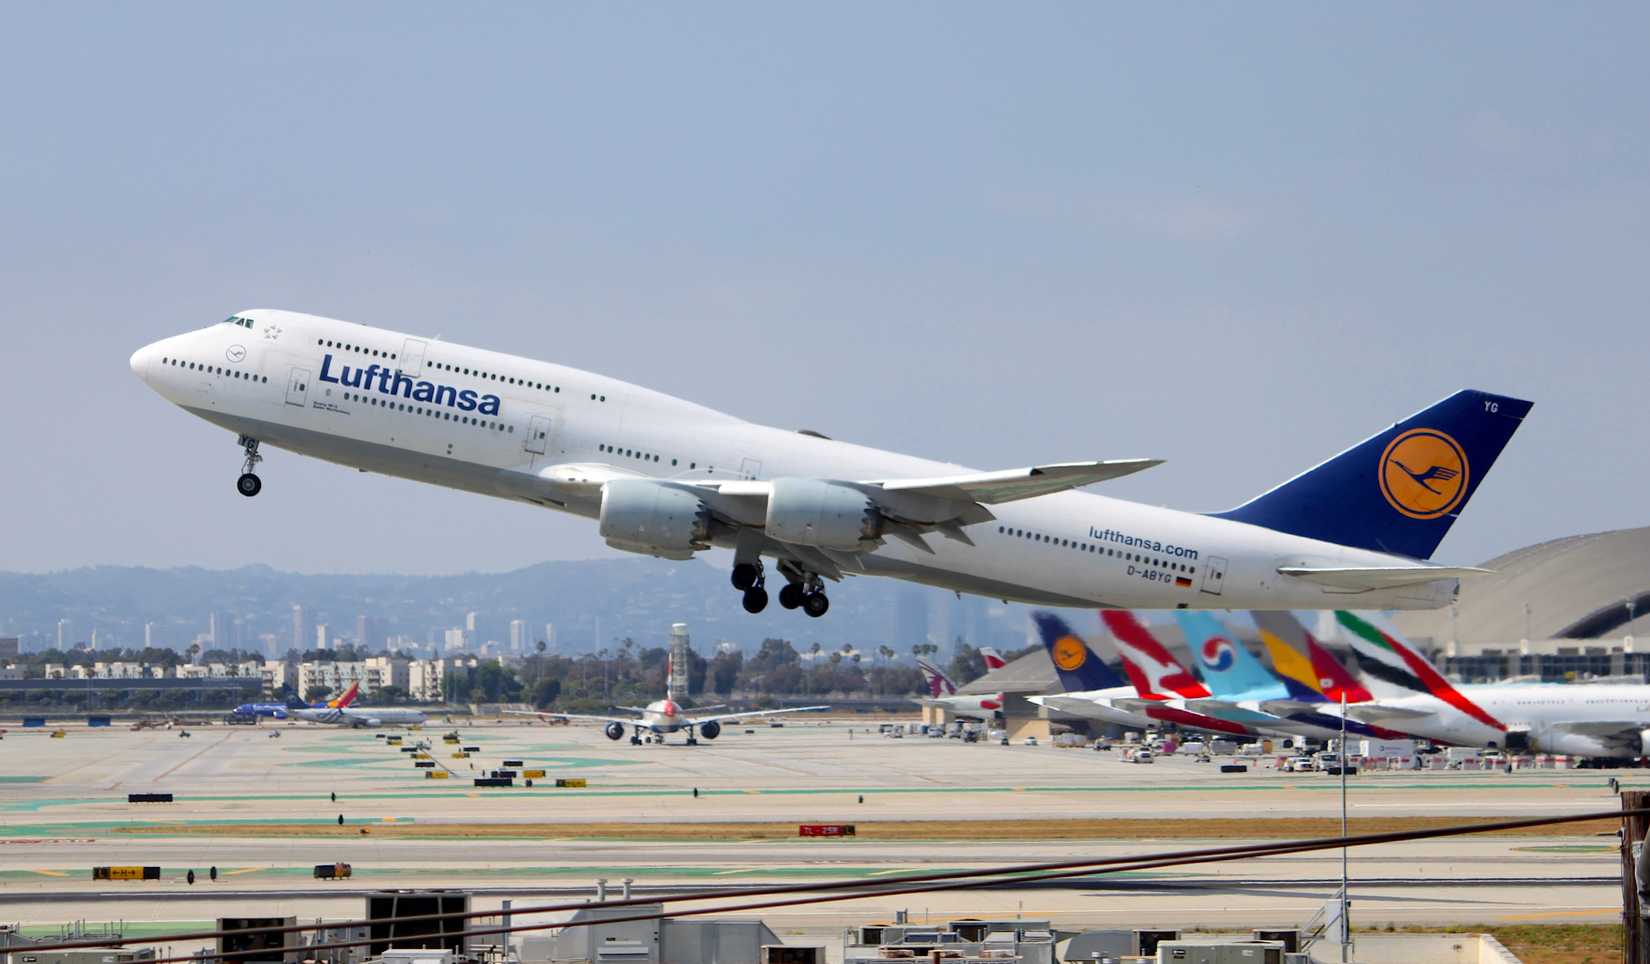
Frankfurt Airport (FRA)

![]()
|
Category: |
Specification: |
|---|---|
|
Total number of connections: |
73,221 |
|
Total number of destinations served: |
207 |
With 73,221 connections and 307 nonstop destinations, FRA remains Europe’s premier cargo belly gateway and a major transfer node for the Star Alliance. The airport’s parallel runways and extensive remote stands enable peaky schedules, although security bottlenecks and construction will periodically challenge overall passenger flows.
Lufthansa’s long-haul rebuild includes growing India and North America demand, with resilient intra-Europe feed underpinning Frankfurt’s resurgence. Rail integration expands the catchment area far beyond just the small region of Germany in which this airport lies.
5
Seoul Incheon International Airport (ICN)
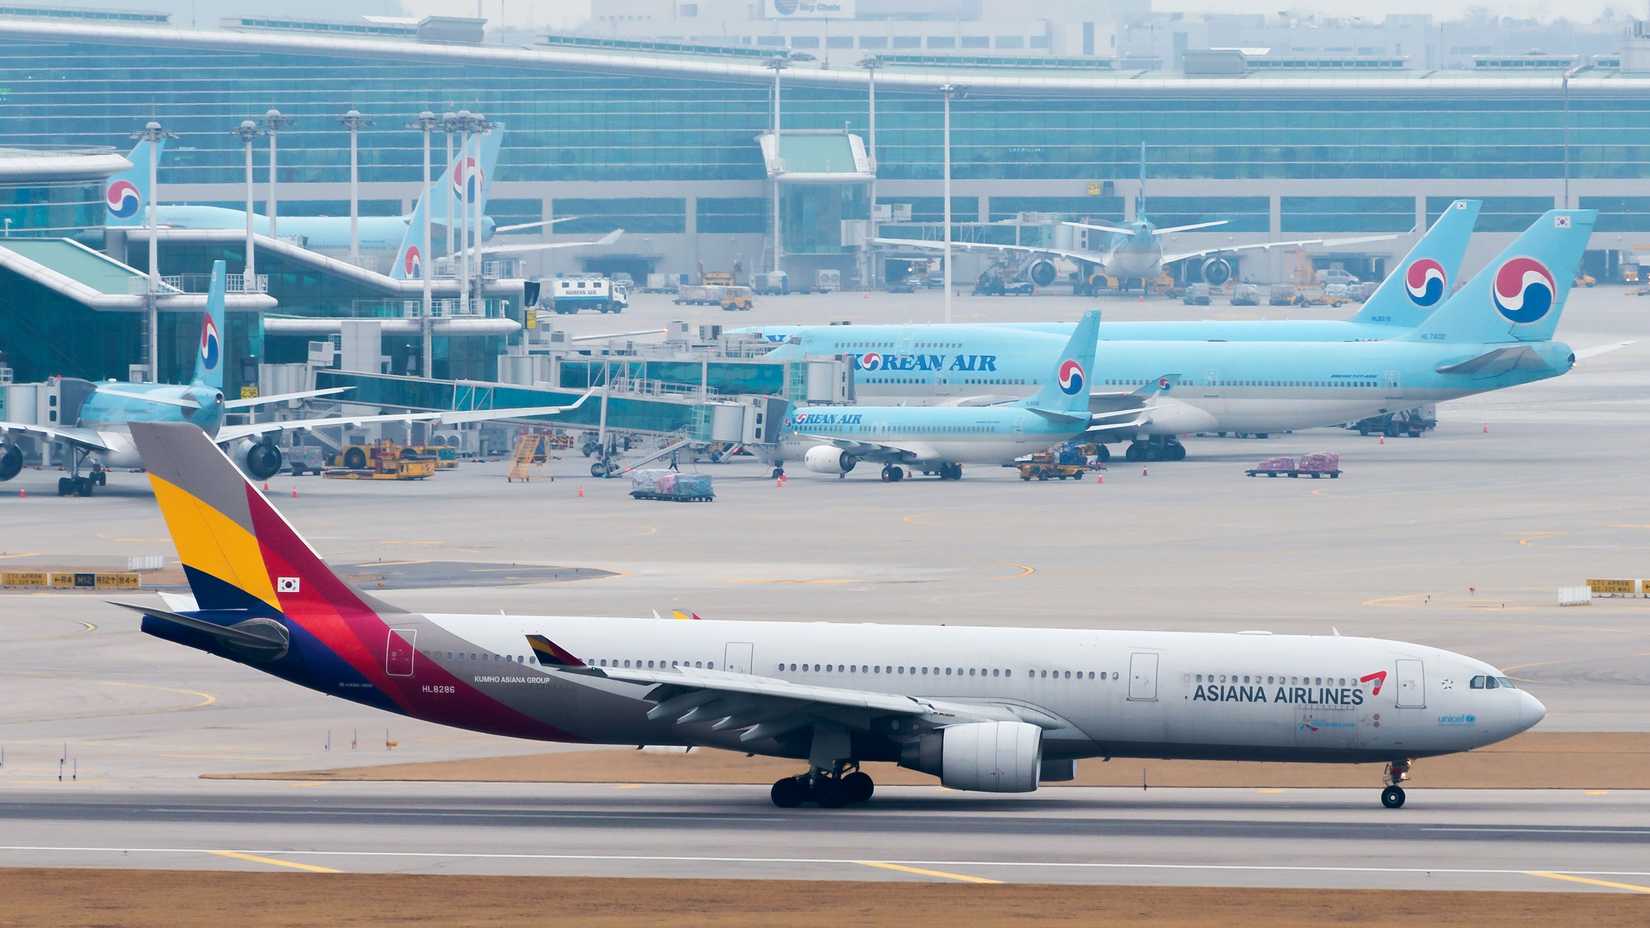
Seoul Incheon Airport (ICN) currently ranks sixth, down one place over last year. The airport continues to be the most important and most efficient connecting hub in Northeast Asia. Korean Air is the airport’s largest individual operator, accounting for around 22% of flights after a successful merger with Asiana Airlines.
|
Category: |
Specification: |
|---|---|
|
Total number of connections: |
41,572 |
|
Total number of destinations served: |
179 |
ICN accounts for around 41,572 connections, including flights to 179 destinations. Fast transfers, disciplined punctuality, and generous minimum connecting times have all been catalysts for the airport’s continued growth.
The airport’s island layout, offering multiple runways and modern terminal buildings, delivers reliability even during peak flight times. Strong origin-and-destination demand to Seoul exists, and growing traffic to Southeast Asia supports overall stability.
4
Chicago O’Hare International Airport (ORD)
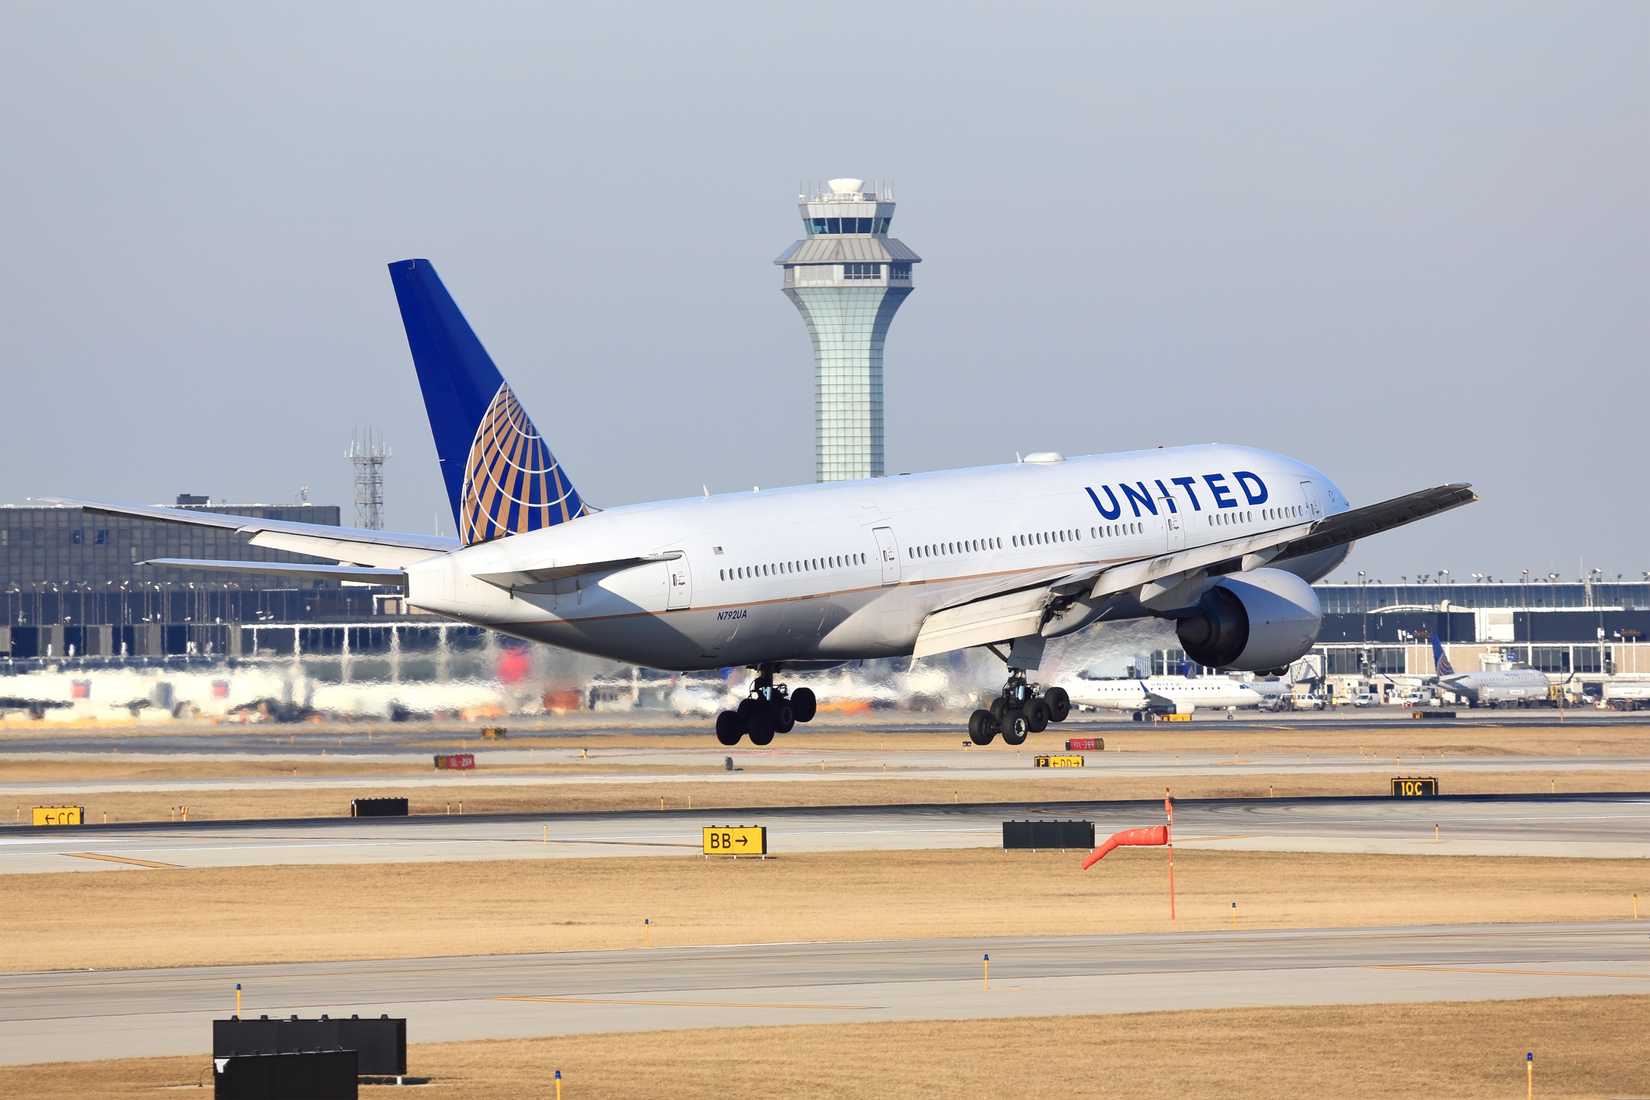
Chicago O’Hare International Airport (ORD) is in seventh position, rising from ninth place. United Airlines is the facility’s lead carrier, accounting for around 49% of flights. ![]()
|
Category: |
Specification: |
|---|---|
|
Total number of connections: |
65,141 |
|
Total number of destinations served: |
297 |
O’Hare posts around 65,141 connections and flights to around 297 destinations, leveraging a central location in the United States and extensive runway capacity following recent airfield modernization efforts. The dual-hub dynamic at the airport balances domestic breadth with deep transatlantic and transpacific links, while cargo and maintenance ecosystems add continued resilience.
Terminal projects and gate expansions continue, although construction can come at the cost of peak-hour traffic flows. Incremental growth at the airport is certain to follow as long-haul demand continues to strengthen and the Midwest’s economy continues to grow. The airline will continue to optimize bank structures in order to improve connection quality while protecting on-time performance during weather-sensitive winter operations periods.
3
Atlanta Hartsfield-Jackson International Airport (ATL)
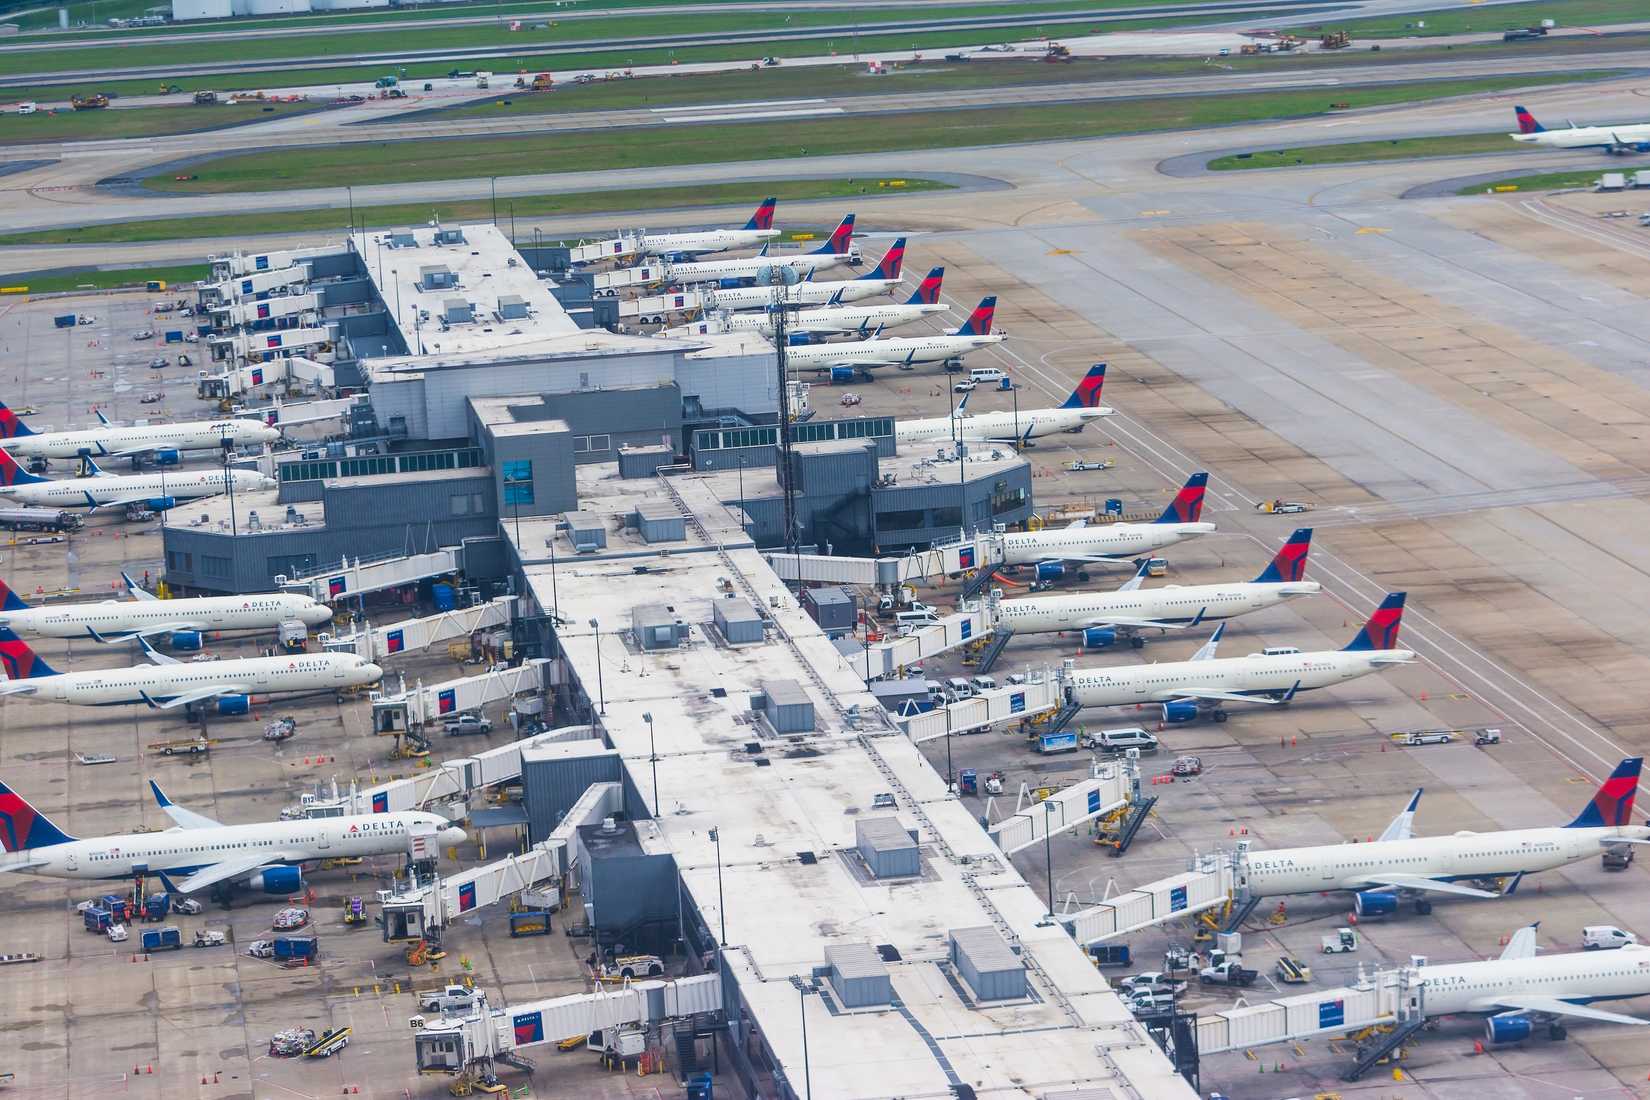
Atlanta Hartsfield-Jackson International Airport (ATL) ranks eighth in 2025, although it remains the quintessential global megahub. ![]()
|
Category: |
Specification: |
|---|---|
|
Total number of connections: |
53,374 |
|
Total number of destinations served: |
251 |
With 53,374 connections and 251 destinations, ATL’s overall scale and parallel runway complex help support reliability through periods of challenging weather. The airport’s single-terminal layout features multiple concourses and efficient train links that preserve short connection times.
The airport is a hub for business travel and demand across the Southeast United States. It is the largest and most important gateway for Delta’s network to Latin America.
2
Tokyo Haneda International Airport (HND)
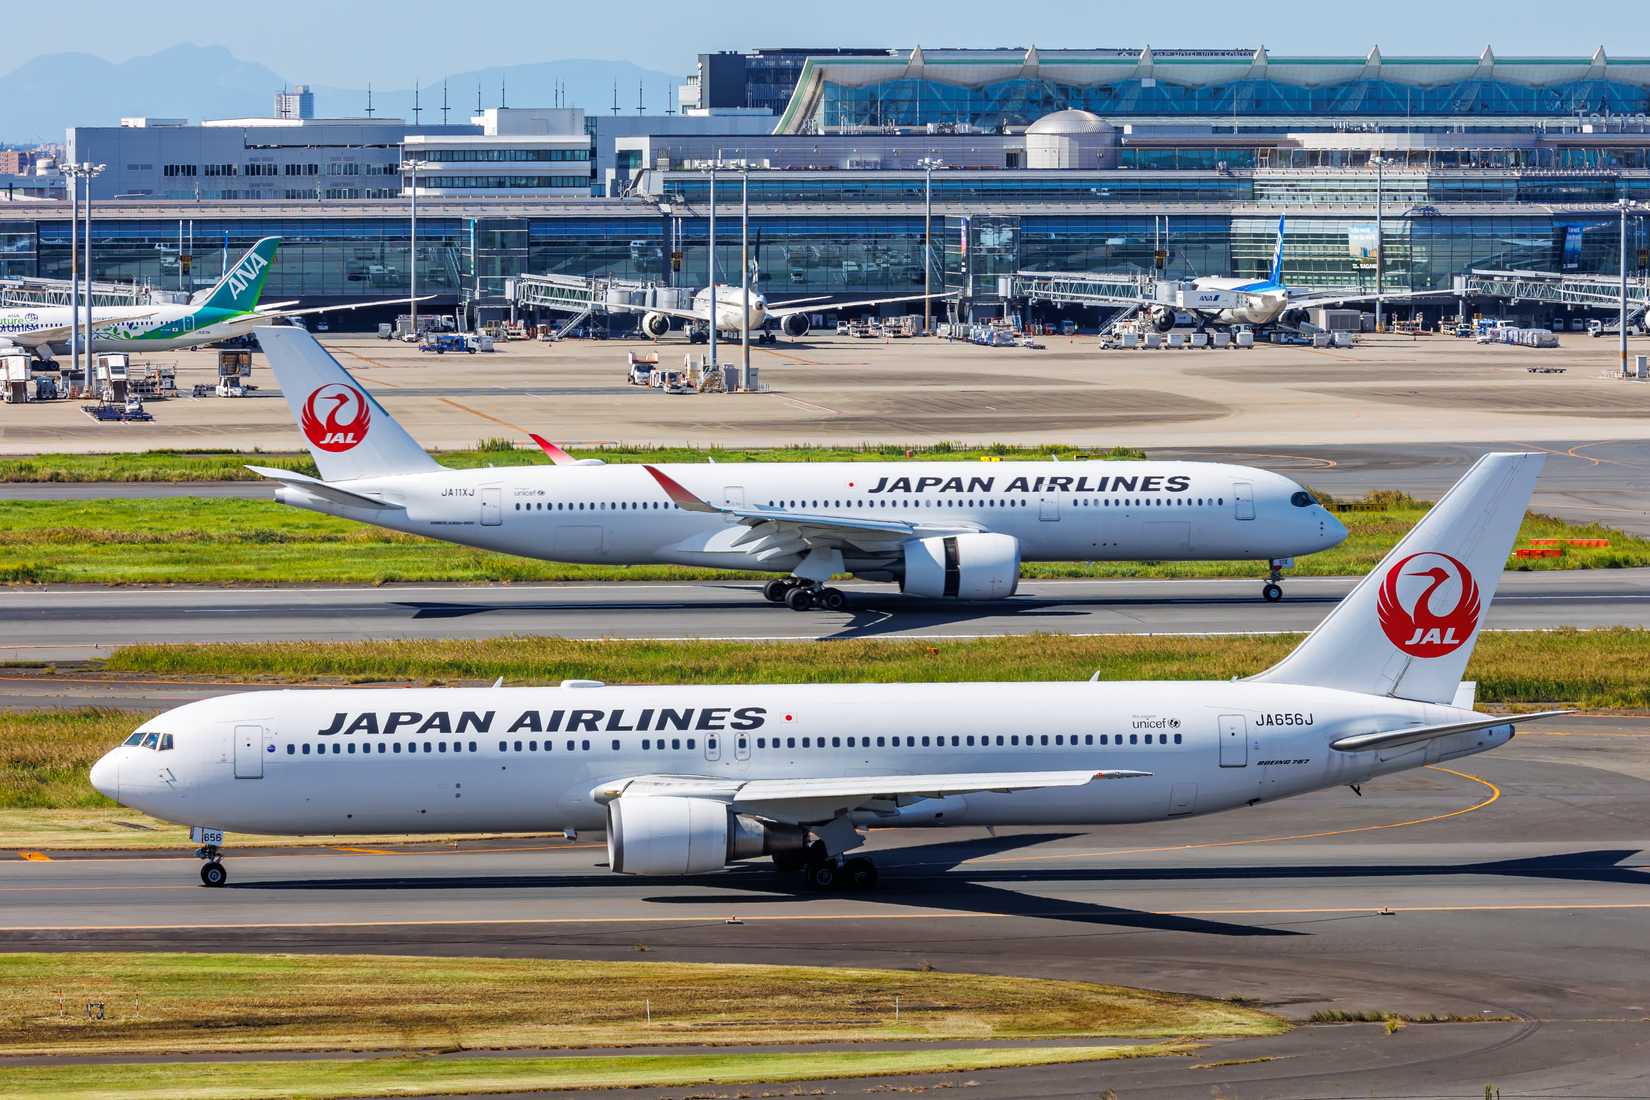
Tokyo Haneda Airport (HND) slips to ninth after ranking third last year, reflecting a continued normalization of Japan’s traffic mix and overall slot reallocations. All Nippon Airways leads with around 36% of flights, while Japan Airlines and foreign carriers sustain overall breadth.
|
Category: |
Specification: |
|---|---|
|
Total number of connections: |
22,243 |
|
Total number of destinations served: |
107 |
Tokyo Haneda accounts for around 22,243 connections and flights to over 100 destinations, with extensive links across Asia. The airport’s location and terminals have been key catalysts for its continued growth.
Passengers can expect continued expansion as corporate travel strengthens. Flights to the United States are increasingly proving popular.
1
Paris Charles de Gaulle Airport (CDG)
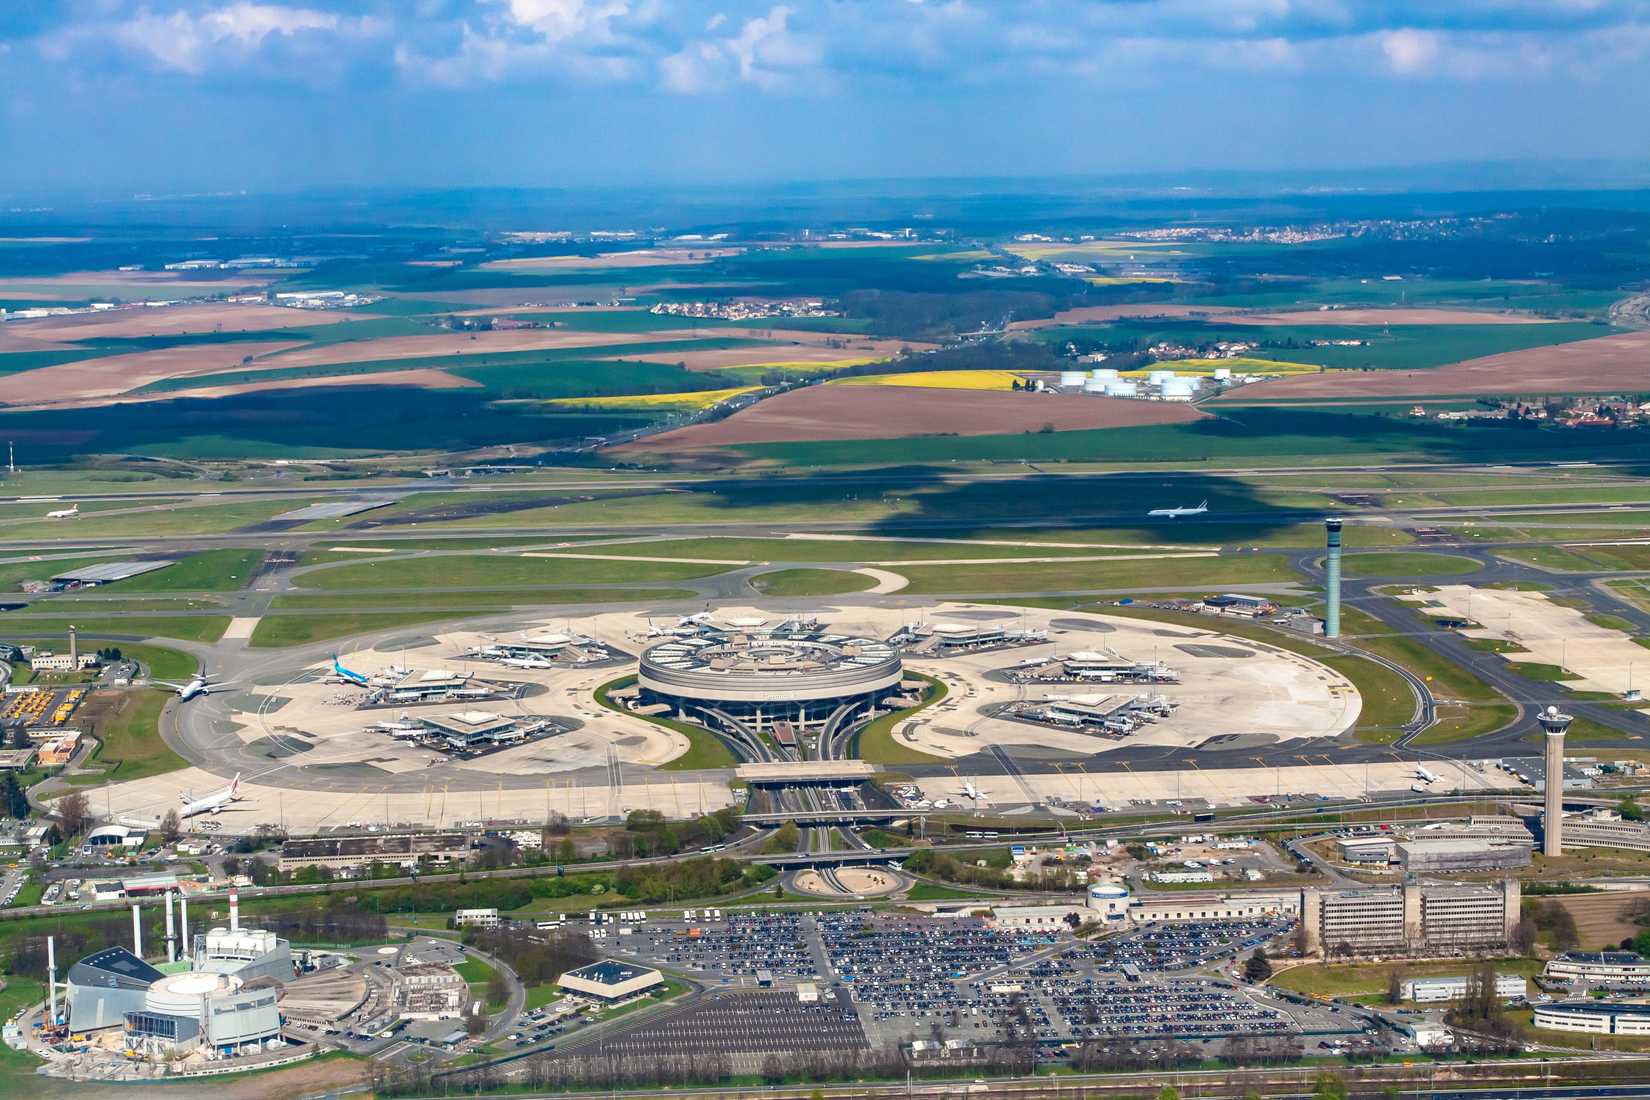
Paris Charles de Gaulle (CDG) is the final airport to enter our list after ranking seventh last year. Air France accounts for around 56% of flights, anchoring SkyTeam connectivity across Europe, Africa, the Middle East, and the Americas.
|
Category: |
Specification: |
|---|---|
|
Total number of connections: |
57,014 |
|
Total number of destinations served: |
299 |
Paris Charles de Gaulle accounts for around 57,014 connections and flights to roughly 299 destinations worldwide. The facility is served by parallel runways and has a number of remote stands.
Rail links widen the overall catchment area and facilitate smooth transfers between terminals. Peak congestion and occasional strikes can disrupt operations.
source